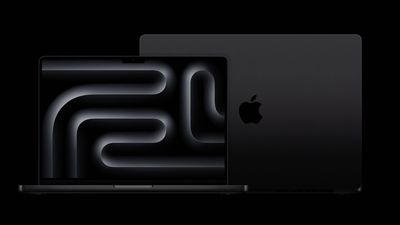
Apple is planning to refresh the MacBook Pro with M4 chips starting in late 2024, and this guide aggregates everything that we know about Apple's M4 MacBook Pro plans.
M4 Update
Apple built the M3 chip on a new 3-nanometer process, and we are not expecting a node change for the M4. It too will be a 3-nanometer chip, but Apple supplier TSMC could introduce updates that make it more efficient and faster.
New artificial intelligence capabilities are rumored for Apple's upcoming products, and so the M4 will focus on AI. Apple wants to improve performance for AI functionality, and rumors suggest that the M4 (and the A18 chips for iPhone) will have an upgraded Neural Engine with "significantly" more cores.
The M3 chips all have a 16-core Neural Engine, and Apple has not increased the Neural Engine cores for several years.
Entry-Level 14-Inch MacBook Pro
With the M3 chip launch last year, Apple did away with the 13-inch MacBook Pro. It's been replaced with the 14-inch MacBook Pro, which Apple now offers with three different chip options.
The entry-level 14-inch MacBook Pro has an M3 chip and a $1,599 starting price, and this is the model that will get the standard M4 chip. The current M3 chip has an 8-core CPU and up to a 10-core GPU, and the M4 could be similar.
Higher-End 14-Inch and 16-Inch MacBook Pro Models
For customers who want a more "pro" machine, the higher-end 14-inch and 16-inch MacBook Pro models are set to be refreshed with M4 Pro and M4 Max chips, which are more powerful versions of the faster M4 chip.
The current M3 Pro has up to a 12-core CPU and up to an 18-core GPU, while the M3 Max has up to a 16-core CPU and up to a 40-core GPU. CPU and GPU improvements for the M4 Pro and M4 Max aren't yet known.
Design Changes?
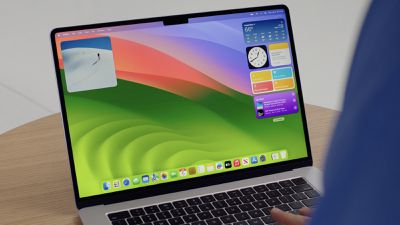
There are no rumors of a design change for the MacBook Pro at this time, and we're not quite due for one. Apple last updated the MacBook Pro design in 2021 with the transition to Apple silicon. In recent history, Apple has redesigned the MacBook in 2012, 2016, and 2021, so following that pattern, we'll see the next design tweak in 2025 or 2026.
This year's M-series update will likely be limited to the MacBook Pro's internals.
Launch Date
According to Bloomberg's Mark Gurman, the entry-level 14-inch MacBook Pro could get an M4 chip in late 2024, while the timeline for the 14-inch and 16-inch MacBook Pro refresh is estimated at late 2024 to early 2025.
We could see the M4, M4 Pro, and M4 Max variants come out all at once like the M3 chip lineup, or Apple could space them out across several months.
The M3 MacBook Pro models came out in October 2023, so a refresh around October 2024 would come at the one-year mark.
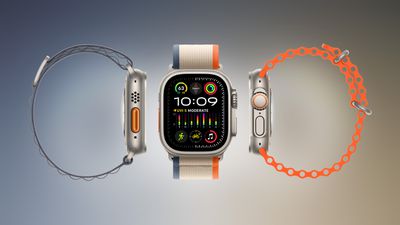
Apple today began selling certified refurbished Apple Watch Ultra 2 models in the U.S. for the first time since the device was released in September.
As of writing, refurbished Ultra 2 models with the Blue, Orange, or White Ocean Band are available for $679, compared to $799 brand new.
Like new Ultra 2 models sold directly by Apple in the U.S. currently, we expect that the Blood Oxygen app is deactivated on the refurbished models, due to a legal battle with medical technology company Masimo. Last year, the U.S. International Trade Commission (ITC) banned Apple from importing and selling Apple Watch models with blood oxygen sensing after it ruled that the feature infringed on Masimo's patents. Apple is appealing the decision, and could re-enable the Blood Oxygen app with a watchOS update if it is overturned.
Availability began in the U.K. and China earlier this week, and the Blood Oxygen app remains functional outside of the U.S. currently.
There are no refurbished Apple Watch Series 9 models available on Apple's store in the U.S. yet.
Apple on late Thursday into Friday removed the popular messaging and social media apps WhatsApp, Telegram, Signal, and Threads from its App Store in China at the request of the Chinese government, The Wall Street Journal reported.
In a statement shared with several media outlets, Apple said China's national internet regulator ordered the removal of the apps from the App Store in the country due to unspecified "national security concerns." Apple said it is "obligated to follow the laws in the countries where we operate, even when we disagree."
Apple has complied with similar App Store removal orders from the Chinese government in the past for apps related to VPNs, news, and more.
Note: The discussion thread for this topic is located in our Political News forum, where posting is limited to forum members with at least 100 posts.
As part of the changes introduced in Europe in iOS 17.4, Apple gave third-party payment apps and banks direct access to the NFC chip, allowing for non-Apple Pay tap-to-pay payment options. The European Commission is set to approve Apple's plan to open up tap-and-go mobile payments "as soon as next month," according to Reuters.
With NFC access, banks and third-party payment apps can offer contactless payments directly on the iPhone without having to use the Wallet app or Apple Pay. This feature is available in the European Economic Area, and it lets EU users set a default non-Apple wallet app and default contactless payment provider that activates at tap-to-pay terminals or when the iPhone's side button is pressed twice.
The European Economic Area (EEA) is the only area where Apple has opened up NFC access, and developers in other countries cannot access the iPhone's NFC chip for tap-to-pay purposes. Customers will be able to use NFC-enabled apps from their banks and other payment providers with no involvement from Apple.
Apple has long limited the NFC chip in the iPhone and other Apple devices to Apple Pay payments, which has prevented banks and other financial services from providing their customers with direct contactless payment solutions on the iPhone.
Apple first announced plans to open NFC payment technology to third-party developers in Europe in January, and Apple made the change in order to address antitrust charges it was facing from the European Commission (EC). The EC has accused Apple of limiting competition by preventing rival mobile wallets from accessing the NFC chip, and Apple's decision to open it up will prevent fines and other penalties.
On this week's episode of The MacRumors Show, we discuss the latest AI consumer technology and Apple's rumored plans to bring major AI-focused hardware enhancements to the Mac later this year.
We talk through the response to Humane's AI Pin and its widely acknowledged deficiencies, such as its limited utility, subpar camera performance, and steep price point. We also take a look at the Rabbit R1, another AI device that prompts us to question the necessity of such hardware when similar functionalities could potentially be achieved with existing smartphones.
Apple is rumored to introduce M4-series custom silicon chips starting this year, featuring more powerful Neural Engines with more cores to support AI processes. These chips are likely based on the advancements coming to the iPhone 16 lineup's A18 chip, hinting that iPhone-exclusive AI features could later come to the Mac.
We also touch on the progress of AI tools in video editing software, including recent announcements from Adobe Premiere and DaVinci Resolve which have introduced new AI-driven editing features like generative fill and object removal. Such features could see enhanced performance on next-generation Macs with AI-focused chips. The MacRumors Show is now on its own YouTube channel, so make sure you're subscribed to keep up with new episodes and clips going forward:
If you haven't already listened to the previous episode of The MacRumors Show, catch up for our chat with Matthew Cassinelli, one of the minds behind Workflow, discuss Apple Shortcuts and potential improvements and AI features coming to the app in iOS 18.
The MacRumors Show is on X @MacRumorsShow, so be sure to give us a follow to keep up with the podcast. You can also head over to The MacRumors Show forum thread to engage with us directly. Remember to rate and review the podcast, and let us know what subjects and guests you would like to see in the future.
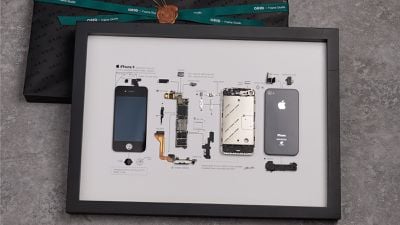
For this week's giveaway, we've teamed up with GRID Studio to offer MacRumors readers a chance to win a 256GB iPhone 15 Pro. GRID Studio is a company dedicated to taking old, retired Apple devices and giving them new life in the form of art.
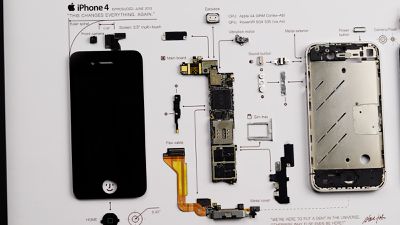
To celebrate Earth Day, GRID Studio is hosting a special deal on one of its most popular products, offering the GRID 4 for just $99. The GRID 4 features a disassembled iPhone 4, with all of the components skillfully arranged to give a look back at Apple's history.
The iPhone 4 is one of Apple's most notable designs, because it introduced the first major design update after the original iPhone, iPhone 3G, and iPhone 3GS. It featured an all-new look with squared edges that felt decidedly modern at the time, and it is an aesthetic that Apple returned to starting with the iPhone 12.
GRID's iPhone 4 piece includes the iPhone 4 internals, ranging from the logic board with Apple A4 chip and PowerVR GPU to the iconic Home button. Components are labeled and arranged in a logical way so you can tell what's what. GRID's art makes a great gift for any Apple enthusiast, and there are many other disassembled iPhone options ranging from the original iPhone to the iPhone X.
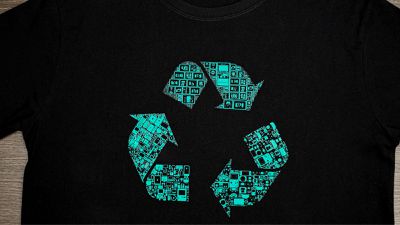
In addition to the sale on the iPhone 4, GRID is discounting all of its products by 15 percent. GRID customers who spend over $30 this week can get a special Earth Day Eco Tee for just $9.99, with the shirt featuring a recycling logo made up of a ton of tiny Apple devices.
We have one 256GB iPhone 15 Pro to give away to a MacRumors reader. To enter to win, use the widget below and enter an email address. Email addresses will be used solely for contact purposes to reach the winner(s) and send the prize(s). You can earn additional entries by subscribing to our weekly newsletter, subscribing to our YouTube channel, following us on Twitter, following us on Instagram, following us on Threads, or visiting the MacRumorsFacebook page.
Due to the complexities of international laws regarding giveaways, only U.S. residents who are 18 years or older, UK residents who are 18 years or older, and Canadian residents (excluding Quebec) who have reached the age of majority in their province or territory are eligible to enter. All federal, state, provincial, and/or local taxes, fees, and surcharges are the sole responsibility of the prize winner. To offer feedback or get more information on the giveaway restrictions, please refer to our Site Feedback section, as that is where discussion of the rules will be redirected.
The contest will run from today (April 19) at 9:00 a.m. Pacific Time through 9:00 a.m. Pacific Time on April 26. The winner will be chosen randomly on or shortly after April 26 and will be contacted by email. The winner will have 48 hours to respond and provide a shipping address before a new winner is chosen.
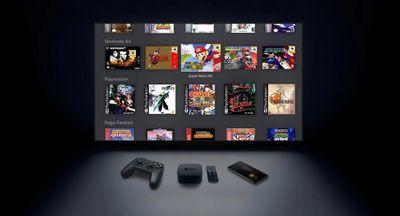
The lead developer of the multi-emulator app Provenance has told iMore that his team is working towards releasing the app on the App Store, but he did not provide a timeframe. Provenance is a frontend for many existing emulators, and it would allow iPhone and Apple TV users to emulate games released for a wide variety of classic game consoles, including the original PlayStation, GameCube, Wii, SEGA Genesis, Atari 2600, and others.
Apple has so far approved emulators on the App Store for older Nintendo consoles and the Commodore 64. For example, Riley Testut's popular Delta emulator is now in the App Store in many countries, and it can emulate games released for the Game Boy Pocket, Game Boy Color, Game Boy Advance, Nintendo Entertainment System (NES), Super Nintendo Entertainment System (SNES), Nintendo 64, and Nintendo DS. Provenance would bring the first Sony, SEGA, and Atari emulators to the App Store if approved.
Provenance has been in development since 2016, and it can already be sideloaded on the iPhone and the Apple TV outside of the App Store.
Apple updated its App Review Guidelines earlier this month to allow "retro game console emulator apps" on the App Store for the iPhone, iPad, Mac, and other devices. Earlier this week, Apple told us that emulators that can load games (ROMs) are permitted on the App Store, so long as the apps are emulating "retro console games" only. It is unclear if Apple will consider consoles like the GameCube and Wii to be "retro."
While a U.S. court ruled that emulators are legal, downloading copyrighted ROMs is typically against the law in the country. On its customer support website for the U.S., Nintendo says that downloading pirated copies of its games is illegal. A wide collection of public-domain "homebrew" games are available to play legally.
BLUETTI, a company known for its portable power stations and associated accessories, is currently running an Indiegogo campaign for its new SwapSolar ecosystem of app-enabled products. The launch products in the SwapSolar family include a high-capacity power station with removable hot-swappable batteries plus a multifunction portable cooler. Together, they can keep your perishables cool for up to six days while completely off the grid, or essentially indefinitely with occasional access to power.
The crowdfunding campaign for the SwapSolar campaign is drawing to a close in just a few days with over $1.1 million pledged by backers, and I've been testing out both main products in the lineup to see how they work, including their app integration that lets you keep tabs on the accessories and make adjustments right from your iPhone.
3-in-1 Portable MultiCooler
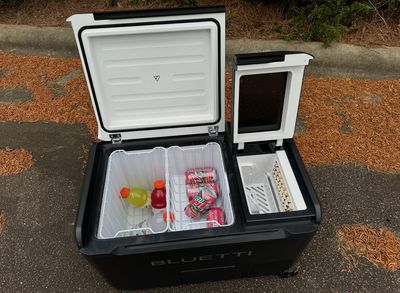
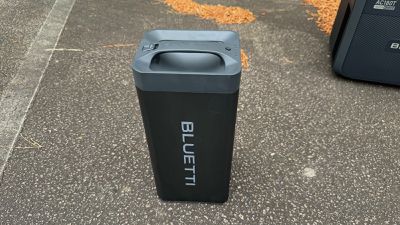
The highlight of the lineup is the unique 3-in-1 Portable MultiCooler, which can serve as a fridge, a freezer, and an ice maker. BLUETTI says it's the first portable fridge powered by high-density LFP batteries, which retain 80% of their original capacity even after 3,000 cycles. A single BLUETTI B70 battery can power the fridge for up to three days, but it can also run off a standard electrical outlet, a 12-volt socket such as those found in vehicles, or solar panels.
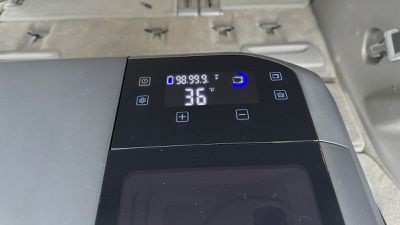
The fridge compartment has a 40-liter/42-quart capacity with an additional 9-liter/9.5-quart ice maker compartment that can produce ice in just 15 minutes from an onboard water tank. The fridge itself features a rapid cool-down mode that can chill the compartment from 85º F (30ºC) to freezing in 15 minutes, and you can set the temperature to as low as –4º F (–20 ºC), so it will work as either a fridge or a freezer.
In my testing, the unit was capable of holding temperature quite well both slightly above and below freezing. BLUETTI recommends keeping the fridge fairly full of items and minimizing the amount of time the lid is left open to help minimize temperature fluctuations, but even with only a few items in the fridge I only ever saw the temperature briefly rise by a degree or two following a quick opening of the lid.
The ice maker is a neat functionality of the MultiCooler, allowing for on-demand generation of ice cubes in two size options for drinks or other needs. Simply fill the ice maker compartment with between 400 ml and 1 L of water, and start up the ice-making cycle. The unit does the rest automatically, passing water over a chilled metal grid to freeze it in sets of 24 cubes.
I wouldn't call even the larger-sized cubes substantial by any means, but they can be made quickly and do the trick for keeping a drink cold. An initial cycle took about 25 minutes to produce a set of cubes, and two additional sets from the same batch of water took about 10 minutes each. You can set the ice maker to produce one set of cubes at a time, or it can run continuously for as long as its water supply holds up or until the ice basket fills up, spitting each batch of cubes into the basket as the cycle completes and immediately starting a new one.
It is worth noting that running an ice-making cycle diverts the unit's power to that function, resulting in the fridge portion gradually warming up. I had the fridge compartment set at 35 ºF, and over the course of the approximately 50 minutes as I ran multiple ice-making cycles, the fridge temperature gradually rose to 44 ºF. It only took about 10 minutes to return to 35 ºF once I stopped making ice, and I didn't notice nearly that much effect on every test series, but it's definitely something to be aware of if you've got perishables in the fridge.
BLUETTI recommends that you change out the water reservoir for the ice maker every 24 hours and fully clean the compartment every three days for hygienic reasons. The unit can run its own 20-minute self-cleaning cycle on the ice-making components, provided it has enough water and power to do so.
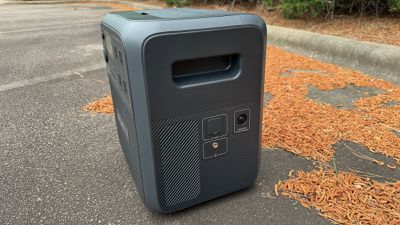
In addition to its primary function as a fridge, the MultiCooler can also charge other devices, provided you have a battery installed in the unit. A 100-watt USB-C port and a 15-watt USB-A port are located on the side of the unit, making it easy to plug in a laptop, phone, or other device for recharging.
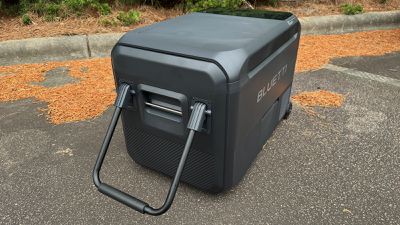
The most notable physical aspect of the MultiCooler to me is its sheer size and weight. It's rather large at 28 inches (71 cm) by 16.5 inches (42 cm) by 18.7 inches (47.5 cm), so it'll definitely be easier if you've got an SUV, pickup, or van to haul it to wherever you're going. Large coolers are certainly common equipment for camping and picnicking, but it's worth noting that this MultiCooler will hold considerably less than a similarly sized basic cooler, considering the space taken up by the active cooling components and the ice maker.
But even more than the size, it's the weight that limits the MultiCooler's portability, as it tips the scales at almost 53 pounds (24 kg) on its own. A battery weighs an additional 18.7 pounds (8.5 kg), so for on-the-go functionality you're looking at over 70 pounds (32 kg) before you've even put any food or ice-making water into it.
Fortunately, the MultiCooler has convenient recessed handles built into the sides of the unit, but lifting it in and out of a vehicle can still be quite difficult for some people trying to do it by themselves. The removable battery and food baskets can help break the load up into a few pieces to get it out of your vehicle, but the main unit remains quite heavy on its own. However you manage to get it on the ground, a pair of wheels at one end and a padded folding handle at the other do make it easy to pull along behind you, provided the terrain isn't too rough.
I found operation to be pleasantly quiet, with BLUETTI saying it remains under 30 dB in fridge mode and under 45 dB in ice-making mode. To my ear in the real world, it's nearly inaudible in refrigeration mode, and I only occasionally notice the cooling kick on and off depending on how close I am to the unit. It's definitely louder in ice-making mode, but even that is a relatively low-level fan-like hum that isn't very disruptive.
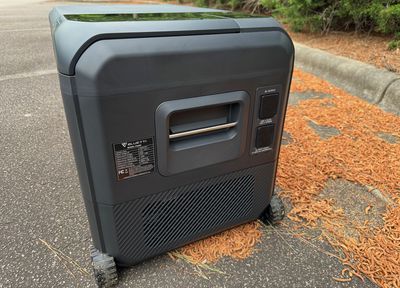
AC180T Power Station
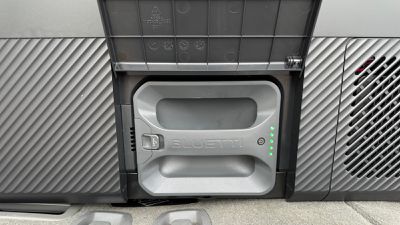
What makes SwapSolar an ecosystem is the swappable batteries for running a variety of gadgets while away from other power options, and that's where BLUETTI's AC180T power station comes in. It's a high-capacity backup power station with two hot-swappable batteries that can either be used in the AC180T to power various gadgets via AC or USB or be removed to power other accessories like the MultiCooler. With the two B70 batteries included in the AC180T, the fridge can run for up to six days before the batteries need to be recharged.
Removing the batteries is as simple as flipping open the top lid of the power station and pressing a small spring-loaded button on the top of the battery, which allows it to be lifted straight out. The power station seamlessly continues to function with the other battery remaining inside, while the removed battery can be transferred to the MultiCooler to provide power for that device.
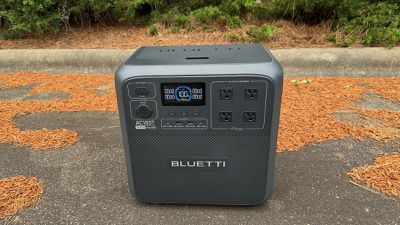
The AC180T is capable of handling sustained loads of up to 1,200 watts with a single battery installed or up to 1,800 watts with two batteries installed, and it can handle transient spikes of up to 2,700 watts to support devices with high startup power draw. With a total capacity of 1,433.6 watt-hours, BLUETTI notes it can recharge an iPhone over 120 times, but with four AC outlets and four USB ports (two USB-C and two USB-A), it can power an array of devices simultaneously.
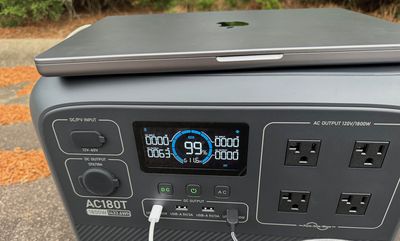
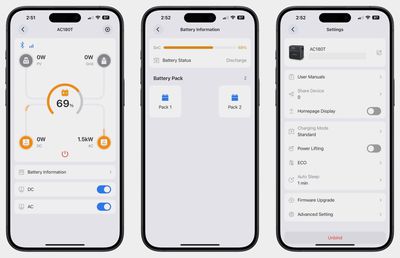
A large multicolor LCD screen gives you all of the information you need at a glance, including the current charge level of the power station's batteries, input and output power draw, estimated time remaining until full charge or depletion, and more. Dedicated physical buttons control whether power is flowing to the AC outlets, the DC USB ports, or both, with the screen also offering an array of other status icons.
The AC180T barely flinched while recharging a MacBook Pro and an iPhone, as a power station this large is capable of much more. I was also able to run multiple lamps, an electric kettle, and a fan from it simultaneously, as long as I had both batteries installed. Trying to run my 1,500-watt electric kettle with only one battery installed tripped the protection system given the 1,200-watt limit with one battery, but it worked fine with two batteries installed.
How long the available power will last is of course a direct function of how much load you're putting on the power station, but with over 1,400 Wh on board, there's plenty to go around for most items. Something like my electric kettle would quickly run through the power in under an hour of constant use, but it only needs to run for a few of minutes to produce a full pot of boiling water.
Even with its high-capacity batteries, the AC180T can be recharged quickly, with AC wall power being the quickest method. BLUETTI says it can accept up to 1,440-watt input via AC, enough to fully recharge both batteries from empty in around 70 minutes. In my testing, I indeed saw power draw from the wall of over 1,000 watts, supporting rapid recharging of the system.
In one portion of my testing, I ran through 50% of one battery in about 24 hours of use with the MultiCooler, so it wasn't quite on pace to meet the three-day target, although I ran quite a few ice-making cycles during that time and I'm sure that sapped a decent amount of power.
The AC180T also supports up to 500-watt charging from solar panel accessories, which BLUETTI says can fully recharge the batteries in under three hours. And if you're out on the road, you can use a 12-volt car power socket, although that will require more like eight hours for a full charge.
BLUETTI App
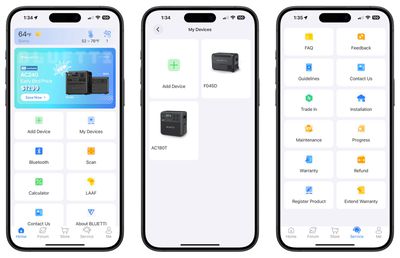
Both the MultiCooler and the AC180T power station are supported by the BLUETTI app, which lets you control them from your phone or Bluetooth. As long as you're within Bluetooth range, you'll have access to a good amount of data on the status of each product, as well most of the same controls (and in some cases more) that are available directly on the products.
The app isn't the cleanest one around, as it's somewhat cluttered with widgets and features many users may not be interested in. The main Home tab includes a weather widget (which I can't seem to get to display accurate information for my location), an ad for current deals on BLUETTI products, and then a series of icons for accessing various functions. Core functions such as accessing existing devices, adding new devices, and accessing user manuals are obviously important, but others like a calculator to estimate how big of a power station you might need to buy should really be tucked away someplace more out of the way.
And that's just the Home tab. A second tab offers access to the community forums, which you can't access until you've created an account for posting and even then the homepage of the forum mostly features ads and announcements about BLUETTI products. The third tab of the app offers access to the BLUETTI store, while a fourth one is where you can access support options and provide product feedback. The final tab is where you manage your BLUETTI account information, set your app preferences, and manage your referrals and rewards.
Overall, the app just feels too promotional and like it's trying to do too much. I just want quick access to my devices (you can pin one, but only one, to the app's Home screen), with the ability to dig into manuals and support options placed somewhere less prominent and other content like ads and community forums omitted from the app entirely.
All of that said, I do find the app useful for monitoring my products, as it provides easy access to status and controls when I'm elsewhere in my house. You're of course limited to Bluetooth range, but it's good enough that I can check in on the MultiCooler and power station in my garage when I'm in a room on the second floor of my house.
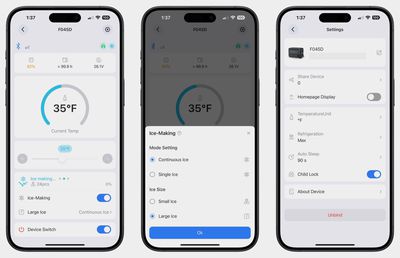
For the MultiCooler, you can see the current fridge temperature, adjust the set point, turn on ice making, set various ice-making options, start a self-cleaning cycle for the ice-making components, view power status, turn the entire unit on or off, and more. It really provides everything I need to see in a glanceable format with a relatively clean design.
For the AC180T, the app offers a graphical overview of power flow, showing current input from solar or the grid and output via AC and DC connections. You can turn the AC receptacles and DC USB ports off via the app, view the status of the installed batteries, and apply firmware updates to the batteries.
How to Buy
The Indiegogo crowdfunding campaign for the SwapSolar system is wrapping up in just a few days, and there are a number of tiers of perks with various combinations of products included, some of which are already shipping to backers and some of which will be shipping soon.
The main combo is priced at $1,719, a savings of 34% (over $900) compared to the regular retail price, and it includes the MultiCooler, a B70 battery to power it, and the AC180T power station with two additional B70 batteries installed. Other combinations starting at $569 for just the MultiCooler and $849 for just the AC180T power station and batteries are also available, ranging up to $2,099 for the full set plus a 200-watt solar panel.
These are obviously some pricey packages, and there are certainly cheaper portable fridge options on the market, but BLUETTI's offerings include many more features and much more flexibility than most competing products. So for those looking for higher-end capabilities, BLUETTI's SwapSolar ecosystem may be an option worth looking at.
Note: BLUETTI provided MacRumors with the MultiCooler and AC180T for the purposes of this review. No other compensation was received. MacRumors is an affiliate partner with BLUETTI. When you click a link and make a purchase, we may receive a small payment, which helps us keep the site running.
This week's best Apple deals include low prices on AirPods and Apple Watch SE, as well as great deals on Anker, Jackery, and Samsung products.
Note: MacRumors is an affiliate partner with some of these vendors. When you click a link and make a purchase, we may receive a small payment, which helps us keep the site running.
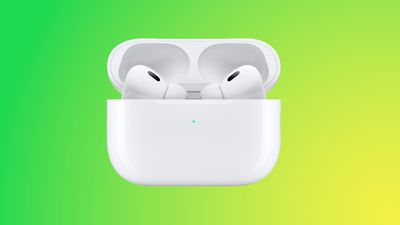
AirPods Pro 2
What's the deal? Get $60 off AirPods Pro 2 with USB-C and more audio deals
Amazon returned this week with a low price on the AirPods Pro 2 with USB-C, available for $189.00, down from $249.00. You can also get the AirPods 2 for $89.00 on Amazon, down from $129.00.
Best Buy has even more deals on headphones and earbuds this week, including savings on JBL, Samsung, and Sony products.
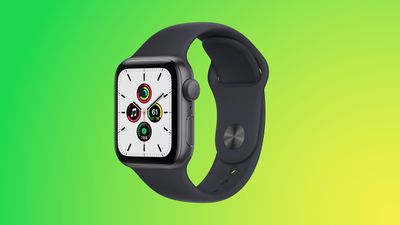
Amazon is taking $60 off the Apple Watch SE this week, including both GPS and cellular models. Prices start at just $189.00 for the 40mm GPS Apple Watch SE and $219.00 for the 44mm GPS model.
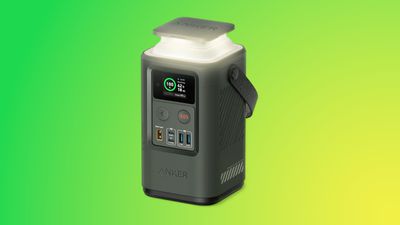
Anker and Jackery
What's the deal? Save on Anker and Jackery accessories
This week we tracked a sale on Amazon with discounts on both Anker and Jackery accessories. There is a wide array of products being discounted, so be sure to visit our original post to see everything, as well as the quick list below for some highlights.
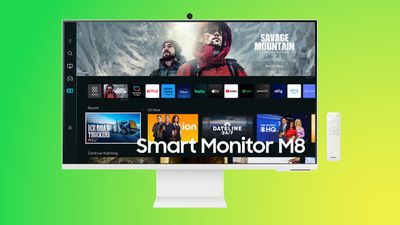
Samsung's monitor sale continues this week, offering $700 off the 27-inch ViewFinity S9 5K Smart Monitor ($899.99) and $300 off the 32-inch Smart Monitor M8 ($399.99). You can find even more deals on TVs, soundbars, smartphones, and tablets in our original post.
Be sure to visit our full Deals Roundup to shop for even more Apple-related products and accessories.
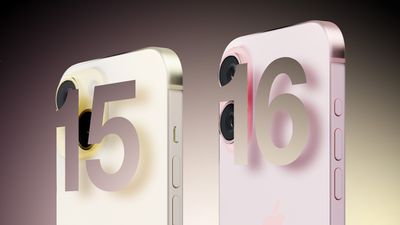
After over a year of reports, there are now more than a dozen specific rumors about the features and improvements set to be offered by the two non-Pro iPhone 16 models later in 2024.
All of the changes the iPhone 16 models are expected to feature compared to their direct forerunners are listed below, using information from a range of reliable sources that we have previously covered. We will update this article as more rumors emerge in the coming months.
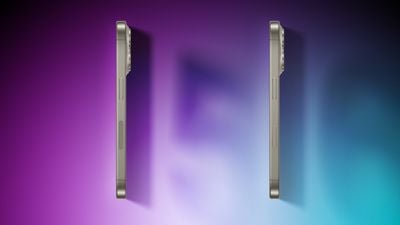
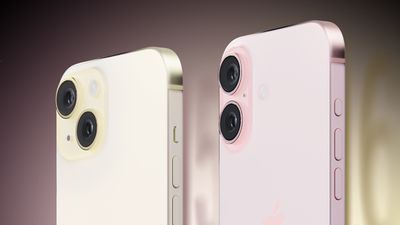
The iPhone 16 and iPhone 16 Plus are expected to largely carry over the design of their predecessors, meaning that they will have the same dimensions. The most noticeable alteration that will denote the new models is said to be a vertical rear camera arrangement to facilitate spatial video capture, but the removal of the mute switch in favor of the Action button introduced on last year's Pro models and the introduction of an all-new "Capture" button will also be important changes.
iPhone 15
iPhone 16
Diagonally arranged rear camera array
Vertically arranged rear camera array to support spatial video capture
Ring/Silent switch
Action Button
"Capture Button" to trigger photography and videography features
The iPhone 16 models are rumored to benefit from a moderate improvement in processing power thanks to an all-new A18 chip with a more powerful Neural Engine to support exclusive generative AI capabilities. We are also expecting 33% more memory and Wi-Fi 6E support.
Enhanced Neural Engine with "significantly" more cores to support new AI features
6GB memory
8GB memory (+33%)
Wi-Fi 6 connectivity
Wi-Fi 6E connectivity
Batteries and Charging
The iPhone 16 models could receive some major improvements in battery technology and charging, sporting denser batteries and faster charging capabilities. It is worth noting that the iPhone 16 Plus is rumored to feature a smaller battery than its predecessor, but it is not clear how this will affect actual battery life.
iPhone 15
iPhone 16
Single-layer battery technology
Stacked battery technology for increased energy density and prolonged lifespan
iPhone 15: 3,349 mAh battery iPhone 15 Plus: 4,383 mAh battery
iPhone 16: 3,561 mAh battery (+6%) iPhone 16 Plus: 4,006 mAh battery (-9%)
The iPhone 16 models are likely to receive several camera enhancements, such as spatial video capture for the Apple Vision Pro. While many of Apple's devices are rumored to receive a series of new AI-based features via software updates later this year, the iPhone 16 models are expected to take these further with exclusive capabilities facilitated by a more powerful Neural Engine in the A18 chip and an upgraded microphone for voice commands.
iPhone 15
iPhone 16
More efficient OLED display with brighter micro-lens technology
Upcoming support for new AI features in iOS 18, plus a suite of device-exclusive AI features
Microphone
Upgraded microphone with improved signal-to-noise ratio and water resistance, designed to support new AI features
Available in Blue, Pink, Green, Yellow, and Black
Available in Blue, Pink, Green, Yellow, Black, White, and Purple
Release Date
The iPhone 16 and iPhone 16 Plus are expected to launch in the fall. Apple usually hosts an event every September to unveil new iPhone models, with launch following just over a week later. For more information about the iPhone 16 models, see our comprehensive roundup.
Will It Be Worth Upgrading?
The iPhone 15 was a significant upgrade over 2023's iPhone 14, introducing a new design with a the Dynamic Island, a 48-megapixel camera, a USB-C port, and more. The iPhone 16's upgrades will likely not be as substantial as those offered by its predecessor. As a result, most iPhone 15 users will have little reason to upgrade, but some who would appreciate AI features, improved performance, spatial video capture, and a dedicated button for photography and videography features may find it worthwhile.
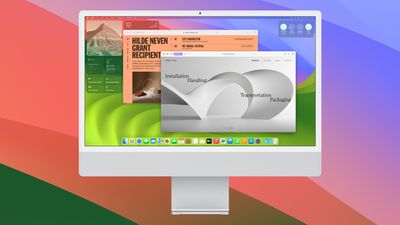
Apple will debut a major revamp of the Calculator app in macOS 15 later this year, according to AppleInsider.
The overhauled version of the Calculator app for Mac will reportedly feature:
An enhanced unit conversion system located in the main user interface, including for currency conversion with up-to-date exchange rates.
"Math Notes" to allow the Notes app to communicate with the Calculator app in mathematical notation, also coming to iOS 18.
A history tape in the sidebar to show previous calculations, likely accessible via a dedicated button on the top left, which also provides options to toggle between all three calculator views: Basic, scientific, and programmer.
Adjustable window size across all three calculator views, with buttons that enlarge and change shape as needed.
The redesigned app will apparently offer a new design inspired by its iPhone counterpart in iOS 18, featuring rounded buttons. macOS 15 is almost certain to be previewed alongside iOS 18 and Apple's other major software updates at WWDC on June 10, followed by official release in the fall.
Best Buy today announced the launch of a new "Envision" app designed for the Apple Vision Pro headset. Envision is designed to allow Best Buy customers to explore different products and see how those products look in their own living spaces.
According to Best Buy, the Envision app is meant to help consumers plan their "ultimate home technology setup." 3D models of Best Buy products are included, so users can see them from all angles and get an idea of the space they take up. The app includes big screen TVs, large and small appliances, computers, furniture, fitness equipment, and more.
There are hundreds of items to scroll through and preview, along with access to product ratings and pricing. Listings can be opened up in Safari on the Vision Pro to make purchases on the Best Buy website.
Another image of an alleged screen component designed for a HomePod with a display was today shared by Kosutami, a source that has in the past shown off HomePod components and abandoned Apple prototypes.
The image shows a circular, glossy glass piece that would be located at the top of a HomePod that has the same design as the current standard size HomePod. The component would replace the current touch/waveform interface, and in the past, Kosutami has suggested that the LCD display is slightly curved.
There have been rumors about a HomePod with a display since 2021, and Apple actually seems to have several products in the works. The simplest is the HomePod that Kosutami and other leakers have referenced, which seems to be just a traditional speaker with a glass touchscreen. The display will show information from Apple Music like the song that's playing, and it will allow for SharePlay and other features.
Bloomberg's Mark Gurman has said that Apple is working on a HomePod speaker with an iPad-like display and a built-in camera, and also a HomePod with a screen mounted on a robotic arm. Apple analyst Ming-Chi Kuosaid in 2023 that Apple would release a HomePod with a 7-inch display at some point in 2024, though it doesn't look like that's happening at this point.
It's not really clear when we're going to see a refreshed HomePod at all, and it's possible that Apple is still just experimenting with a variety of designs. That said, the HomePod with a touch-responsive LCD display that uses the same design we have today does not seem farfetched, and it's plausible that such a product could come in the not too distant future.
Every year or two, MacRumors videographer Dan Barbera shares a desk tour featuring the Mac-centric products that he uses to record and edit his videos for the site. Today, Dan is sharing an updated 2024 desk video, highlighting desk accessories that might be worth checking out for your own setup.
Uplift Desk - Dan uses an Uplift Standing desk, priced starting at $569. Uplift makes all kinds of accessories for its desks, from drawers to hammocks. Dan has a motion board for increasing movement, microphone arm, and headphone holder.
Alti Wireless Charging Desk Mat - The $130 Alti Wireless Charging Desk Mat has a built-in Qi wireless charger that works with the iPhone and AirPods, plus it has a hideaway space for documents.
Gather Monitor Stand - Gather has a selection of Monitor Stands that raise up a display and also offer handy storage for a MacBook. Pricing starts at around $269, and there are add-on accessories for an additional fee.
Iodyne Pro Data - This one is for video editors and those who need a lot of storage that's well-protected. The 12TB Pro Data from Iodyne is priced at $4,450 and goes up from there.
Magic Keyboard and Magic Mouse - There are a lot of options for peripherals, but Apple's Magic Keyboard and Magic Mouse are classics.
Nomad Stand One Max - For charging the iPhone and Apple Watch, Nomad's Stand One Max delivers quick charging speeds and aesthetics. It's not cheap at $180, though.
Lab22 Headphone Stand - For over-ear headphones like the AirPods Max, the $85 Lab22 Headphone Stand keeps them up and out of the way when not in use.
What are your favorite desk accessories for your Mac setup? Let us know in the comments below.
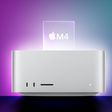
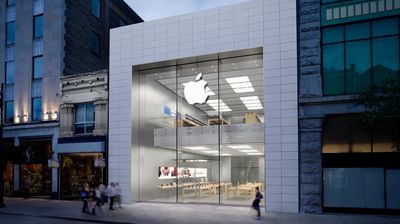
The report cites three sources who said Apple will be opening a new retail store in a 125-year-old heritage building located at 1255 Saint-Catherine Street, which would be less than 100 meters away from the company's current store on the street. Apple's contractors are said to be in the process of completing major renovations to the building, which has been vacant for a few years after clothing retailer Ardene left the space.
Bloomberg's Mark Gurman last year reported that Apple was considering relocating its Saint-Catherine store. At the time, he said Apple aimed to open the new store in February 2025, but the timeframe could change. La Presse reported that Apple's current space on the street is already listed as available for lease online. Apple has not publicly announced any plans to relocate the store, and it did not respond to our inquiry.
1255 Sainte-Catherine Street (Image Credit: LoopNet)
Apple's existing two-floor store on Sainte-Catherine Street first opened in 2008, in Montréal's downtown Ville-Marie area. The store will be temporarily closed for one day on Tuesday, April 23, for reasons unclear, according to Apple's website.
The new location would be Apple's first store within a historic building in Canada, with many of the company's other locations in the country found in indoor shopping malls. Apple recently relocated its store at the Square One shopping mall in Mississauga, Ontario, just west of Toronto, as it continues to modernize its Canadian retail fleet.
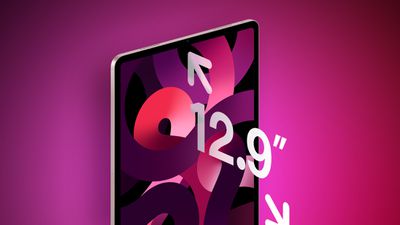
The rumored 12.9-inch iPad Air that is expected to be announced in May will be equipped with a mini-LED display like the current 12.9-inch iPad Pro, according to Ross Young, CEO of research firm Display Supply Chain Consultants. The existing 10.9-inch iPad Air is equipped with a standard LCD panel, and the move to mini-LED technology for the 12.9-inch model would provide increased brightness for HDR content, deeper blacks, and more.
Young revealed this information in a post shared on social media platform X today. He said the 12.9-inch iPad Air will be using leftover mini-LED display panels from the 12.9-inch iPad Pro, and he touted lower power consumption as another benefit.
Given that Apple does not have existing inventory of 10.9-inch mini-LED display panels, it is likely that the smaller iPad Air will remain equipped with an LCD panel.
Meanwhile, the next iPad Pro models are widely expected to transition to OLED displays, which would eliminate backlighting to allow for higher contrast ratio with true blacks, and provide other enhancements compared to LCD and mini-LED technologies. The new iPad Pro models are also expected to be announced in May.
Young has a solid track record with display-related Apple rumors, so this information about the iPad Air is likely accurate.
Best Buy today has every model of the 2022 13-inch MacBook Air available for $150 off, matching previous all-time low prices on the notebooks. These prices are available to all shoppers and do not require a My Best Buy Plus/Total membership.
Note: MacRumors is an affiliate partner with Best Buy. When you click a link and make a purchase, we may receive a small payment, which helps us keep the site running.
The 256GB model is on sale for $849.00 and the 512GB model is available for $1,049.00. These deals beat the previous prices we tracked earlier in the year by about $50.
You can get both models in all four colors: Starlight, Space Gray, Silver, and Midnight. Following the introduction of the M3 MacBook Air, Apple knocked the price of the 13-inch M2 MacBook Air down by $100, and it's still selling them alongside the M3 model.
Be sure to visit our full Deals Roundup to shop for even more Apple-related products and accessories.
Few features have promised to revolutionize the way we interact with our Apple devices as much as Siri, the company's ubiquitous virtual assistant. Launched in 2011, Siri was introduced as heralding a new era in human-computer interaction, offering an intuitive voice-controlled interface for accessing information, scheduling appointments, sending messages, and much more. The vision was grand: A personal assistant in your pocket, capable of understanding and acting upon a wide array of voice commands with ease and accuracy. So what happened?
Enthusiasm for Siri has undeniably waned in the intervening years. Despite regular updates and improvements from Apple, Siri has struggled to keep pace with its advancing rivals, and in an era of generative AI chatbots and large language models, Siri's failings have only been magnified. Issues ranging from misinterpreted commands to limited contextual understanding have not only hindered Siri's usability but have also led to an almost universal perception of the virtual assistant as a source of user frustration rather than assistance. This persistent underperformance begs the question: Is it time for Apple to kill Siri and start over?
Siri's Birth Pangs
Siri's conceptual roots at Apple can be traced back to the company's early exploration of human-computer interaction. Thirty years ago, Apple commissioned a group of employees to create a video showing how in the future humans might interact with computers using spoken language. The video, known as "Knowledge Navigator," featured a professor chatting with a virtual assistant to perform everyday tasks and academic research. In one of the tasks, the professor asks the assistant to search for a five-year-old publication. The assistant pulls up an article dated 2006, suggesting the video is supposed to be set in September 2011.
The video was criticized at the time for being an unrealistic portrayal of the capacities of a virtual assistant in the foreseeable future. Yet the demonstration inspired developers Adam Cheyer, Dag Kittlaus, and Tom Gruber, who began AI research on virtual assistants at SRI International, a DARPA-funded research laboratory in Menlo Park, California. Their work would result in a spin-out called Siri, named by Kittlaus after a co-worker in Norway. (Siri is short for Sigrid, which has its origins in Old Norse for words meaning "victory" and "beautiful".)
In February 2010, Kittlaus launched Siri as an app on Apple's App Store. Steve Jobs soon began playing with the app and was impressed with how it allowed the user to search the internet by voice. A few weeks later, Apple acquired the start-up. Siri's AI backend was in place, while its voice recognition technology would be supplied by Nuance Communications. Apple subsequently released its Siri virtual assistant (in beta) for the iPhone 4S in October 2011, just one month later than the fictional future in which Knowledge Navigator had been originally envisioned.
Fiction vs. Reality
Apple marketed Siri as more than just a tool — it was your intelligent assistant ready to help with a variety of tasks. Whether setting reminders, sending texts, making phone calls, or finding information online, Siri aimed to streamline it all with a simple voice command. There was nothing like it at the time and the initial results were impressive, but the underlying promise was that Siri would not only understand you but also learn from you, becoming more efficient and personalized over time.
Regular iOS updates in the intervening years have worked towards making Siri more effective and realizing its original promise. Whenever a new iOS feature comes along, Apple usually ensures that it works with Siri, and these days it can be used to identify songs, get driving directions, send money via Apple Pay, and control HomeKit products, to name just a few of its skills. In 2021, Apple announced that Siri would work offline by default – whenever possible, it would process user requests on-device, with the same quality of server-based speech recognition.
However, even now, the assistant that was supposed to understand context and grow with the user still faces significant challenges with context, understanding, and integration, regardless of whether it pings Apple's servers or processes requests locally. Many Apple device owners often say it struggles with even basic commands. Indeed, many users believe that, at least in some areas, Siri's abilities have gotten worse over time, especially since the release of iOS 17.
It is astounding how bad it is. Even things that used to work fine like asking Siri to send a text message now don’t seem to work consistently anymore. Sometimes she asks me if I want to use the phone number or email, and other times it just tries to call the person. Sigh.
— Joseph Bella (@jbella) March 20, 2024
Michael Tsai's blog has done a good job of recording users' more recent frustrations with Siri. Here are just a handful of serial issues some users have recently reported:
Setting timers instead of alarms.
Bungling music requests (even for purchases that Siri has local access to).
Delayed responses over fast data connections.
Nonsense responses to conversion requests.
Creating notes instead of reminders.
Acknowledging requests without acting on them.
Overwrought punctuation when dictating.
Inability to consistently control smart devices.
The list could go on. But has Siri really gotten more stupid? Could most issues be put down to fringe use cases, or over-expectations in a brave new world of chatbots powered by immensely resource-heavy large-language models? Consider what Walt Mossberg said in 2016, writing for The Verge:
Before Apple bought it, Siri was on the road to being a robust digital assistant that could do many things, and integrate with many services — even though it was being built by a startup with limited funds and people. After Apple bought Siri, the giant company seemed to treat it as a backwater, restricting it to doing only a few, slowly increasing number of tasks, like telling you the weather, sports scores, movie and restaurant listings, and controlling the device's functions.
...On too many occasions, Siri either gets things wrong, doesn't know the answer, or can't verbalize it. Instead, it shows you a web search result, even when you're not in a position to read it.
Many users would agree that very little has changed in the past eight years.
AI Hopes on the Horizon
Apple's next major software update, iOS 18, is rumored to include new generative AI features for Siri that will assist users in their daily lives. "Generative AI" is the key term here. The concept surged in popularity in late 2022, when OpenAI released its ChatGPT chatbot that can reply to questions and prompts with unnervingly nuanced human-like responses. The company has since expanded into generative AI tools for images and videos.
One leaker has suggested that Apple is planning to use large-language models to entirely revamp Siri and turn it into the "ultimate virtual assistant." Rumors suggest that improvements could come in the form of better natural conversation capabilities (potentially aided by an improved iPhone microphone) and improved user personalization. The new functionality is expected to be available across devices, so Siri may retain conversation information from one device to another. According to Bloomberg's Mark Gurman, one of the specific features Apple is developing is an improved interaction between Siri and the Messages app, which would let Siri auto-complete sentences more effectively and answer complex questions.
However, more recent reports have claimed that Apple is not planning to debut its own generative AI chatbot. Apple has reportedly held discussions with companies such as Google, OpenAI, and Baidu about potential generative AI partnerships, but Apple's first set of new AI features in iOS 18 will not rely on cloud servers at all, according to Gurman.
Move Over Siri?
Whether or not a groundbreaking incarnation of Apple's virtual assistant is on the cards, given the persistent issues that have tarnished Siri's reputation, could a new name and branding help Apple distance itself from past failures?
The idea of rebranding Siri into something entirely new has been floated by some observers in the tech world. Josh Johnson's blunt assessment echoes a common sentiment: "I honestly think Apple should kill the Siri brand. I'm not sure it can recover from the universal understanding that it’s just not good." He suggests the introduction of an LLM-powered assistant under a new name, proposing a fresh start to overcome the negative associations that currently plague Siri.
Ty Belisle supports a drastic transformation, noting, "I've thought they should make a very bold 'Siri 2.0' announcement, but it's true the name Siri is so spoiled that they should ditch it." He also points out the practical benefits of a new name, such as reducing accidental activations — a problem that shorter names like "Siri" often face.
John Gruber's perspective underscores the importance of first impressions and the long-term effects of Siri's underwhelming performance: "First impressions really matter, but in Siri's case, it's over a decade of lived experience." If Apple has significantly improved its voice technology, he argues, it should be introduced under a new brand to signify a clean break from the past.
These voices present a compelling case for rebranding, but Apple would face significant risks if it introduced a new virtual assistant. Siri is deeply integrated into Apple's ecosystem and recognized worldwide. Abandoning the brand could confuse and alienate existing users who are accustomed to the name and functionality, despite its flaws. That being said, unlike Amazon's Alexa and Google's assistant, Siri has become the butt of numerous jokes. A new name and persona for the assistant could potentially revitalize its image, but Apple would have to ensure that any new product lives up to its promises, otherwise another misstep could be potentially disastrous.
What are your thoughts about and experiences with Siri? Has its performance gotten better over time as Apple's software has become more complex, or is it in a death spiral? Let us know in the comments.


 The current Apple Sainte-Catherine store
 1255 Sainte-Catherine Street (Image Credit: LoopNet)